This article is about the ChannelBuddy dashboard and provides insights into the functions you can track for your feeds and channels.
In the „Articles“ category, you can track the number of items, the number of errors/warnings, the last update, and the status, giving you an overview.
The chart displays the number of your items over time within the last 14 days. It provides a structured overview of your items in the feed and allows you to see when changes occurred or if there are any anomalies.
Below this chart, you will find an overview of your subfeeds in a tabular format for your existing channels. Using this table, you can track the channel names, the last update, feed activity, the number of products in the subfeed, the number of successful changes, the number of changes with warnings, and the number of changes with errors.

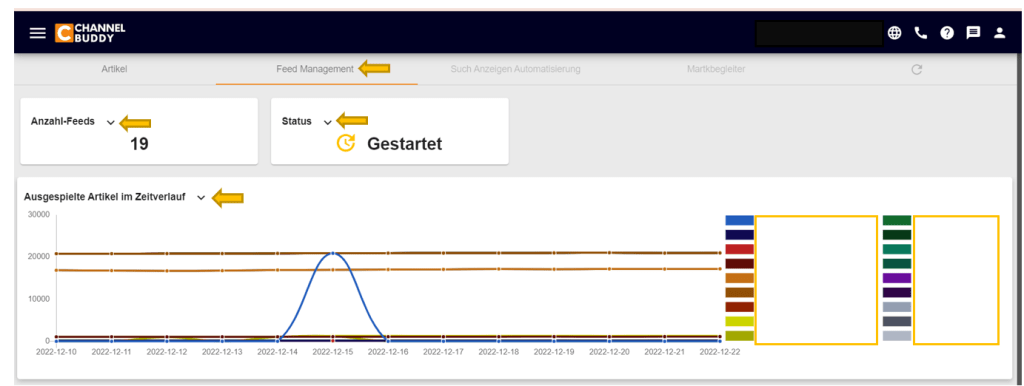
Using the Feed Management, you can discover the following:
- Number of articles in the feed: Here, you can see the total number of items in the feed.
- Status: This indicates the status of the feeds.
- Published articles over time: By examining the timeline within the last 14 days, you can track your channels. The colored boxes represent different channels, which can also be identified in the chart by the colored lines.
In the „Feed Overview“, you can view your channels, the corresponding feed names, statuses, feed activity, the number of articles, and the last update.

Neueste Kommentare